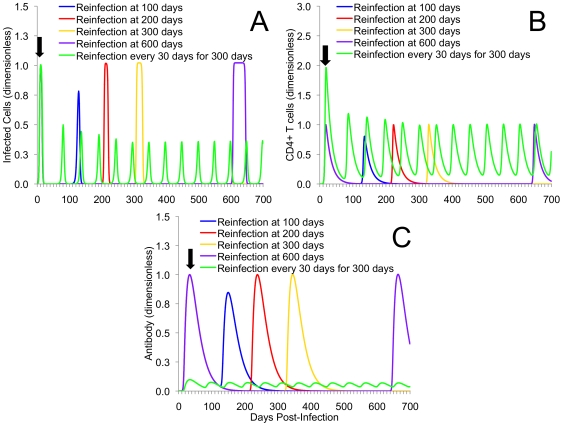
Figure 5. Multiple re-exposure experiments using the extended model.
Displayed are the kinetics of infected cells (A), CD4+ T cells (B), and chlamydia-specific antibody (C) for single reinfection at either 100, 200, 300, or 600 days after initial infection in the extended model. Also included is the simulated kinetics of frequent re-exposure every 30 days over 300 days after initial infection under antibody deficiency. As time of second infection occurs at increasingly long intervals from initial infection, the magnitude of infection and immune responses increases. It should be noted that, for frequent re-exposure scenarios oscillatory behavior occurred once a deficiency in antibody is created, and they continue once infection pressure is removed. This demonstrates the dominance of a critical negative feedback antibody levels have on controlling reinfection. Black arrow indicates point of initial infection (common to all scenarios). For parts (B) and (C), initial immune cell levels are higher (part B) and lower (part C) at initial infection because of imposed antibody deficiency. The magnitude and time evolution of the system of equations in both (A), (B), and (C) are presented non-dimensionally.

