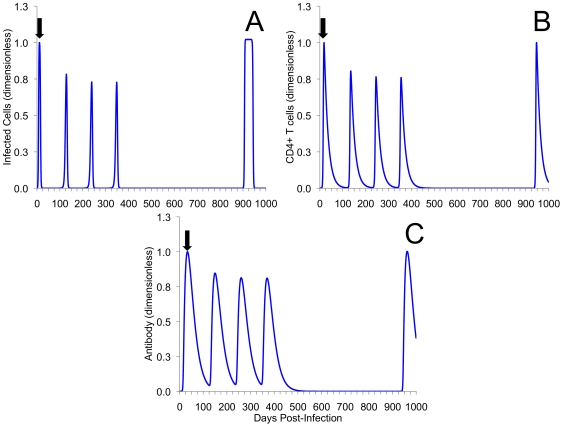
Figure 6. Higher initial re-exposure followed by a long period of no exposure.
Displayed is the kinetics of infected cells (A), CD4+ T cells (B), and chlamydia-specific antibody (C) for the extended model with re-exposure every 100 days over a span of 300 days followed by single re-exposure 900 days after initial infection. With some level of pre-existing ‘immunity’ reinfection is demonstrated to be less severe. However, once infection pressure is removed, and immunity is allowed to wane, reinfection closely resembles initial infection. These scenarios were used to represent higher initial rates of exposure, between 100 and 300 days, followed by low exposure between 300 and 900 days. Black arrow indicates point of initial infection. The magnitude and time evolution of the system of equations in both (A), (B), and (C) are presented non-dimensionally.

