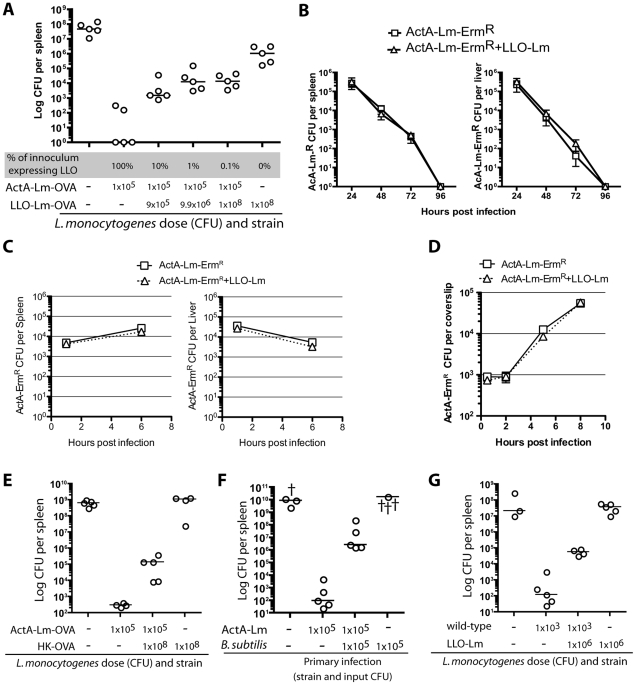
Figure 1. L. monocytogenes within a phagosome impairs protective immunity.
Mice were infected with 1×10⁵ CFU ActA-Lm–OVA alone, or in combination with increasing doses of phagosome-confined LLO-Lm-OVA. (A) Mice were challenged 60 days later with a lethal dose of wt L. monocytogenes-OVA. Spleens were harvested 3 days later and CFU per spleen determined. (B) Mice were infected with 1×10⁵ CFU ActA-Lm-ErmR alone, or in combination with 1×10⁸ CFU LLO-Lm. Erythromycin-resistant colonies were enumerated from the spleen and liver over 96 hours. Each data point represents the mean and standard error of 5 mice per group. (C) Mice were infected with 1×10⁵ CFU ActA-Lm-ErmR alone, or in combination with 1×10⁸ CFU LLO-Lm. Erythromycin-resistant colonies were enumerated from the spleen and liver at 1 and 6 hours post infection. Each data point represents the mean and standard error of 5 mice per group from one representative experiment of two. (D) Bone marrow-derived macrophages were infected with ActA-Lm-ErmR alone (at 1∶10,000), or in combination with 1×10⁸ CFU LLO-Lm (at 1∶200). Erythromycin-resistant colonies were enumerated at the indicated timepoints. Each data point represents the mean and standard error of 3 independent coverslips per timepoint from one representative experiment of two. (E) Mice were infected with the indicated combinations of 1×10⁵ CFU ActA-Lm–OVA and 1×10⁸ heat-killed ActA-Lm–OVA. 30 days later, mice were challenged with 1×10⁵ CFU of wt L. monocytogenes-OVA. Spleens were harvested 3 days later and CFU per spleen determined. (F) Mice were infected with 1×10⁵ CFU ActA-Lm, 1×10⁵ CFU B. subtilis, or the combination of both strains. 30 days post infection, mice were challenged and CFU determined. (G) Mice were infected with the indicated combinations of 1×10³ CFU wild-type and 1×10⁶ CFU LLO-Lm. 58 days later, mice were challenged with 1×10⁵ CFU of wild-type L. monocytognes. Spleens were harvested 3 days later and CFU per spleen determined. In all panels, each point represents a single animal with † indicating animals that died before CFU were determined. Lines indicate the median of each group.

