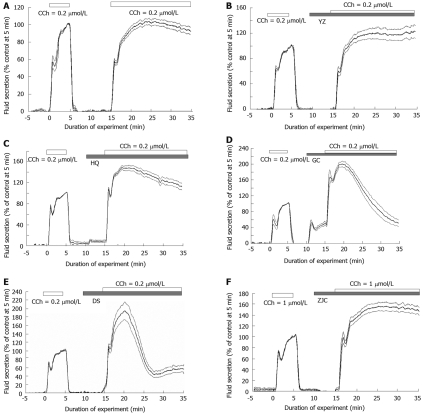
Figure 1.
Time course of fluid secretion during stimulation. A: 0.2 μmol/L carbamylcholine (CCh); B: YZ + 0.2 μmol/L CCh; C: HQ + 0.2 μmol/L CCh; D: GC + 0.2 μmol/L CCh; E: DS + 0.2 μmol/L CCh; F: ZJC + 0.2 μmol/L CCh. The values (%) were normalized by the value at 5 min from the first CCh stimulation (indicated by an open bar on the top of the graph). After washing the CCh for 5 min, Chinese herbs (CHs) were added in perfusion (indicated by a shaded bar). After another 5 min, the second CCh stimulation was added (an open bar, in Figure 1A without CH) to CHs perfusion. The second CCh stimulation was applied (open bar). The values for fluid secretion were statistically unchanged at 5, 10 and 15 min after the start of the second stimulation. The overall sustained phase was continuously raised. The average values (bold line, n =16 from 8 glands in A; n = 12 from 8 glands in B; n = 12 from 6 glands in C; n = 10 from 5 glands in D; n = 12 from 6 glands in E; n = 10 from 5 glands in F) and the mean of standard error (mean ± SE, thin line) are shown. n: The number of sampling points.

