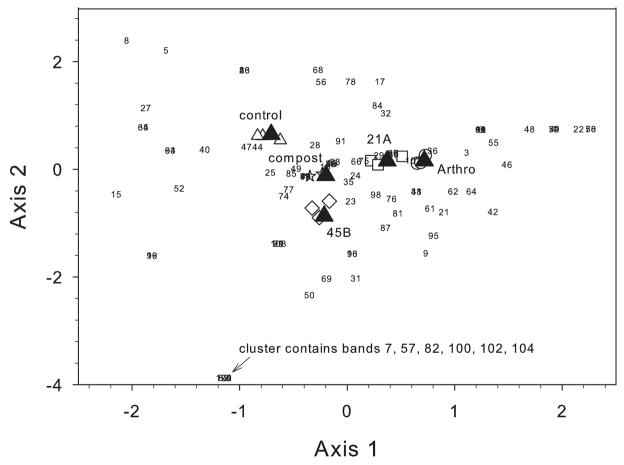
Fig. 3.
CCA of the DGGE bacterial community profile from the B. dactyloides sterile immersion experiment (see also Fig. 1, panel A). This triplot shows the relationship among the bands (represented by numbers in the plot) in the DGGE profiles and the five treatments tested (△ uninoculated control, ⋆ compost, ○ Arthro-inoculated, □ 21A-inoculated, and ◇45B-inoculated). In numerical order, beginning at the top of the gel, a number was assigned to each possible vertical location for a band among the 14 lanes analyzed (triplicate uninoculated controls, triplicate inoculated treatments for Arthro, 21A and 45B, and duplicate compost controls). The location of these numbers in relation to the treatment centroid (▲) can be used to distinguish the relative frequency of occurrence of a band in the different treatments.

