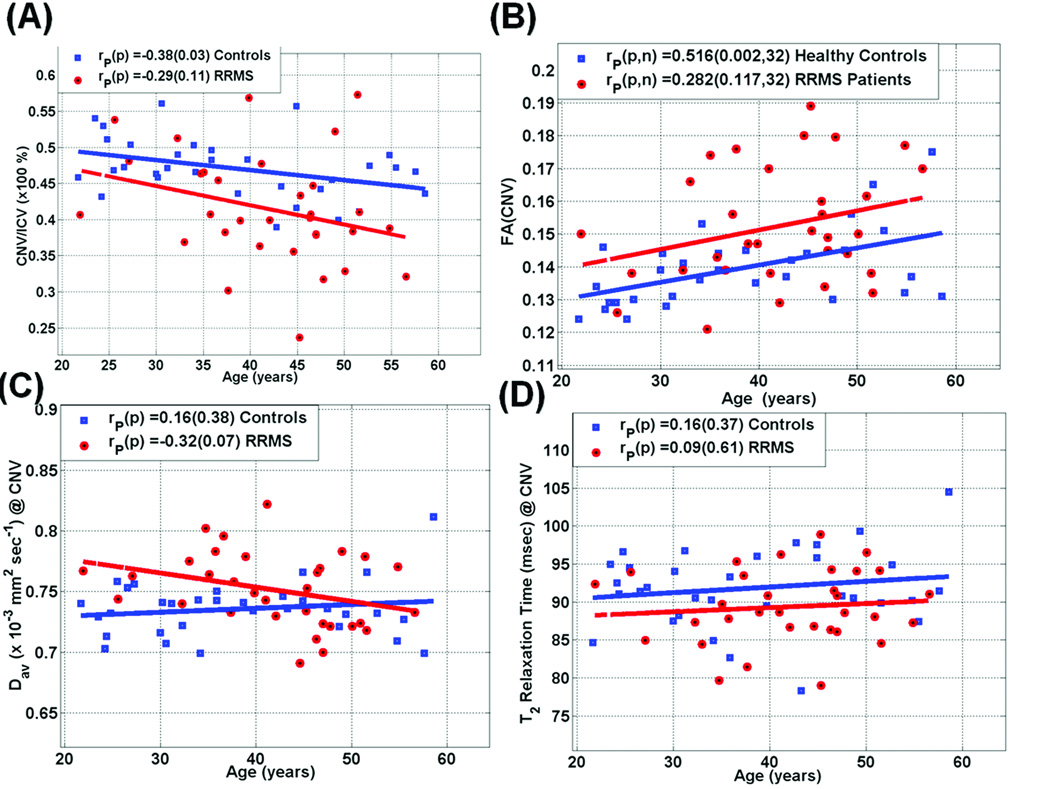
Figure 2.
Scatter plots and regression analysis in both healthy controls and RRMS patients of the MRI metrics in the caudate as age advances (A) CNVp = CNV/ICV*100% (B) Fractional Anisotropy (C) Mean Diffusivity and (D) T2 relaxation Times. The group and correlations with age comparisons are summarized in Table 3. Note the decrease in CNVp, increase in FA, the elevated mean diffusivity and the weak age dependence in both mean diffusivity and T2 values.

