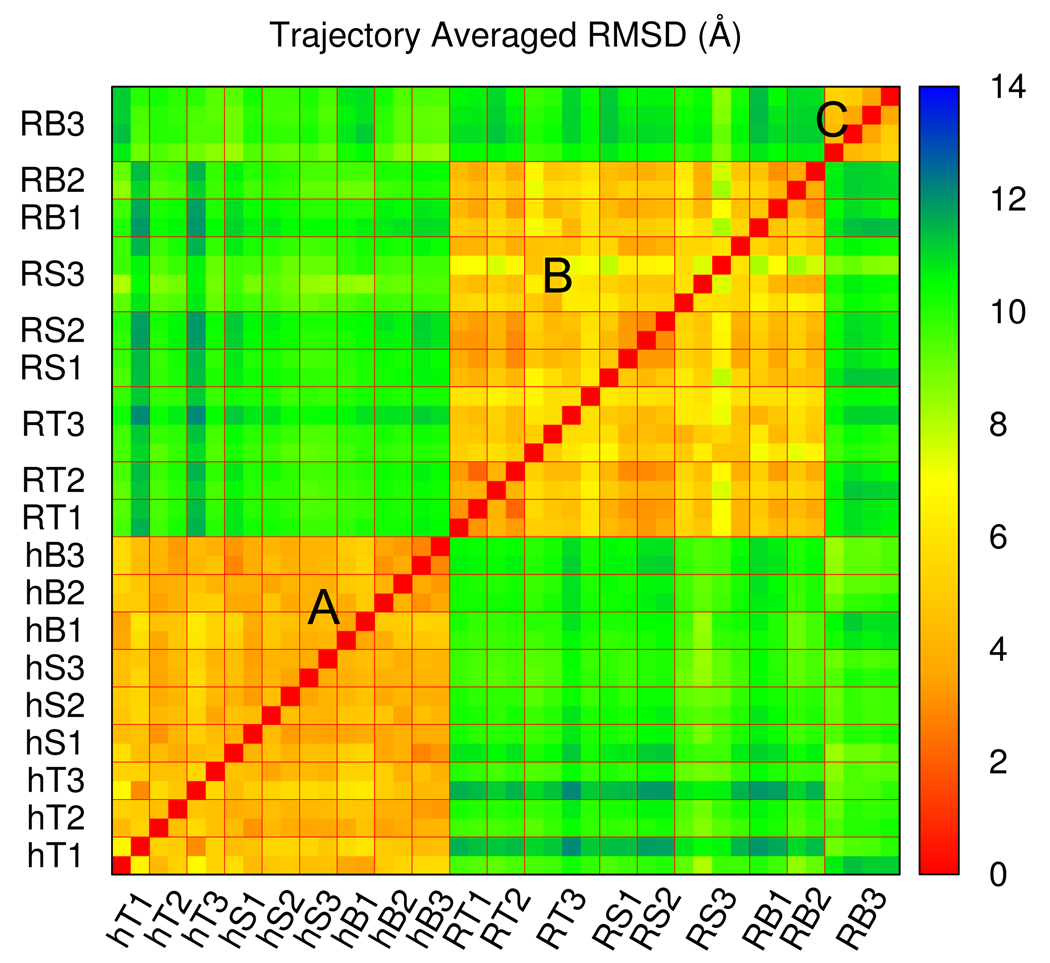
Figure 3.
The pairwise trajectory averaged RMSD matrix for all BdpA unfolding trajectories. Each color square (pixel) shows the value between a pair of unfolding trajectories. Trajectories are arranged in the same order on both axes so that the matrix is symmetric. Multiple trajectories with the same simulation condition are grouped together by thin lines in red and the coding of simulation conditions is as in Table I. Three clusters can be identified as: Cluster A, all h-perturbed trajectories; Cluster B, all Rg-perturbed trajectories except BMD, 10 ns ones; Cluster C, Rg-perturbed, BMD, 10 ns trajectories

