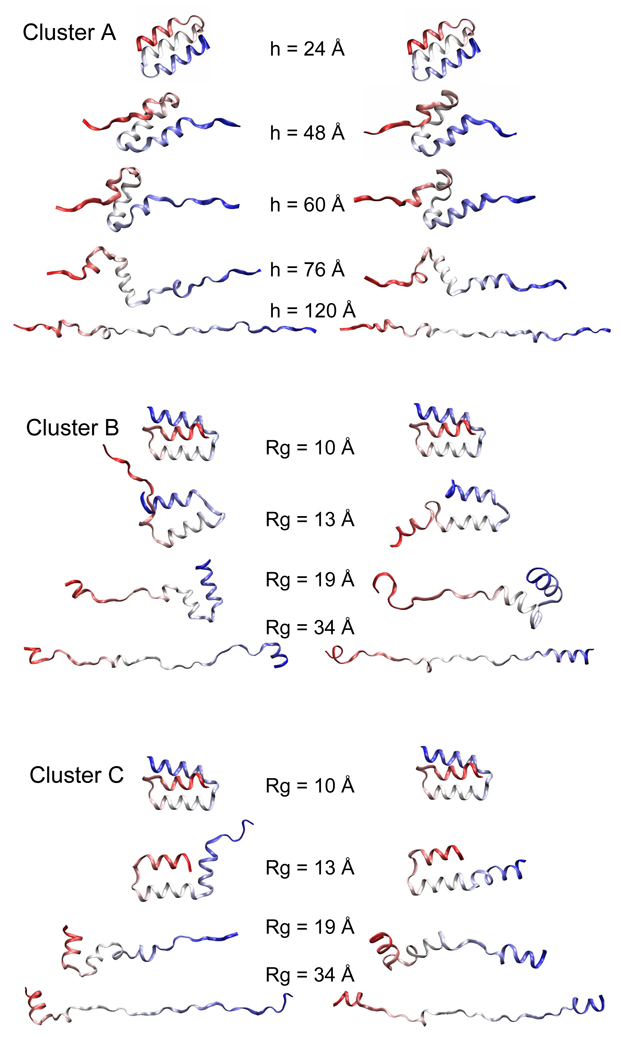
Figure 4.
Snapshots unfolded to different extents are shown for representative trajectories from each cluster. Helix 1, 2 and 3 are shown in red, white and blue, respectively. These ribbon graphs show the sequence of key events involved in the unfolding, including the unwinding of individual helices and the interruption of different tertiary contacts. Two trajectories are shown for each cluster to exemplify variations within a cluster.

