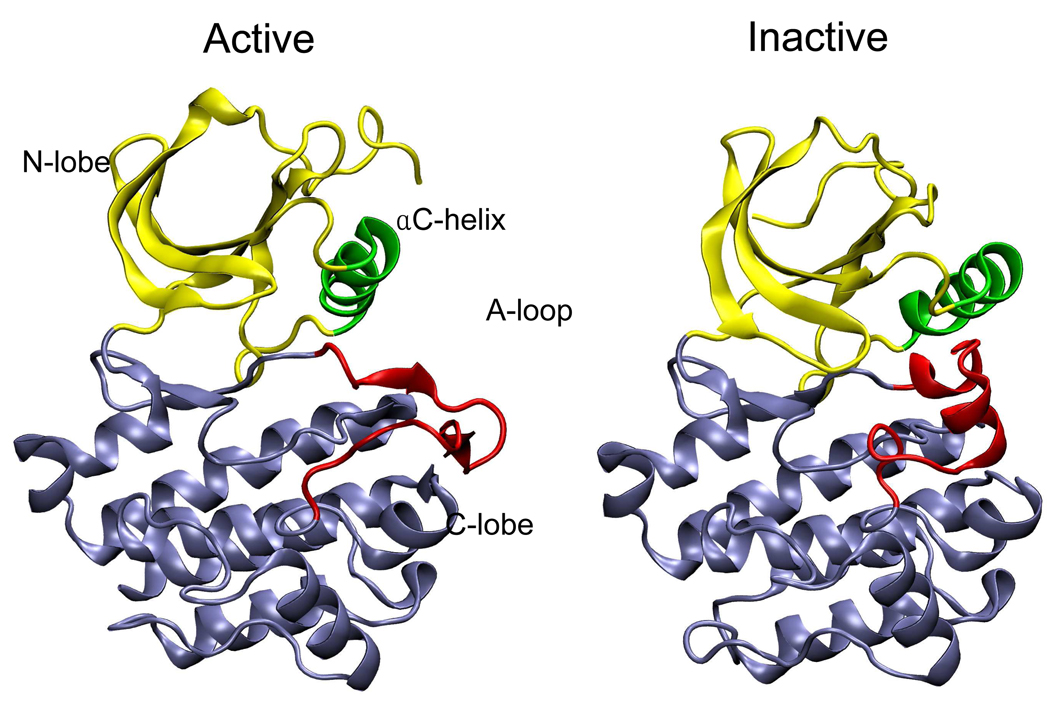
Figure 6.
A comparison of the catalytic domain conformations of a Src kinase Lyn in the active (left) and inactive (right) states. The structures are from equilibrium molecular dynamics simulations23 initiated with coordinates obtained by homology modeling with Lck43 and Hck44 crystal structures. Upon activation, the N-lobe (yellow) and C-lobe (blue) move apart, the helix C (green) moves and rotates inward, and the A-loop (red) deforms from two short helices to extended structure.

