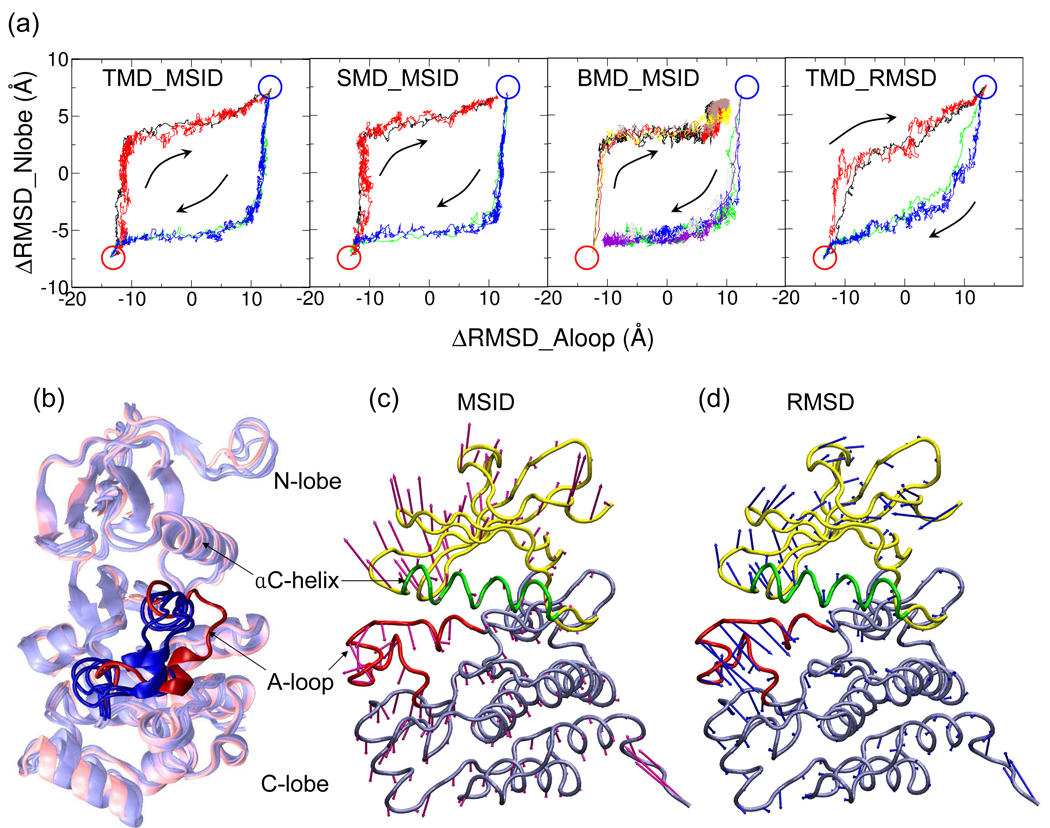
Figure 8.
(a) Lyn CD activation/deactivation trajectories projected on the plane of ΔRMSD of the N-lobe and ΔRMSD of the A-loop. For each panel, multiple trajectories are shown in different colors. See Table II for color coding. ΔRMSD = RMSD(to active)−RMSD(to inactive), super-imposing the C-lobe of the protein. The active and inactive configurations are labeled by red and blue circles respectively, and the transition directions are indicated by arrows. (b) Four snapshots with the N-lobe opened to the same extent from four Lyn CD activation trajectories generated by TMD-MSID, SMD-MSID, BMD-MSID and TMD-RMSD. For each trajectory, the first snapshot that reaches ΔRMSDNlobe = −5 Å is shown. The three snapshots with MSID as the progress variable are colored in blue whereas the one with MSID as the progress variable is colored in red. The A-loop region is shown in solid cartoon representation while the rest of the protein is shown as transparent. (c–d) External forces acting on Lyn CD at the beginning of activation by perturbing MSID (c) or RMSD (d). The forces are averaged for each residue and scaled so that their average magnitude are the same in both cases. RMSD induces relatively greater forces on the A-loop region compared to that MSID does.

