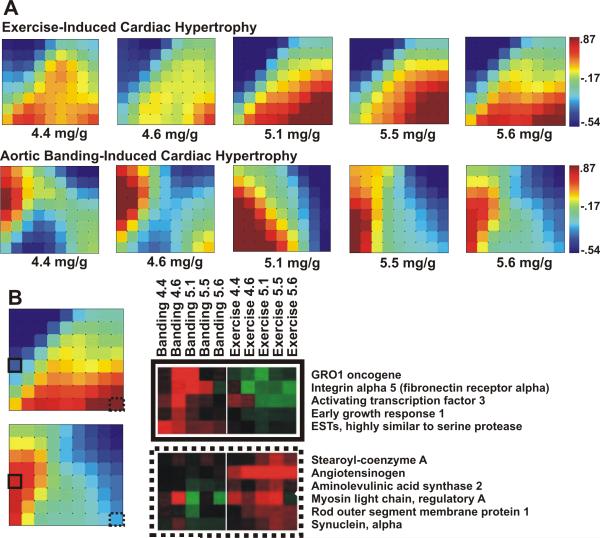
Fig. 2.
(A) Genes expressed primarily in either the adaptive or maladaptive model were input into GEDI to produce mosaics of global gene expression with respect to HW/BW. Scale bars indicate the centroid SLR value associated with each tile color in the mosaics. (B) Inspection of the gene clusters comprising the GEDI mosaics reveals the identities of genes differentially expressed in the hypertrophy models. Heat maps of gene clusters from mosaic tiles with solid and dashed outlines provide examples of genes demonstrating this expression pattern.

