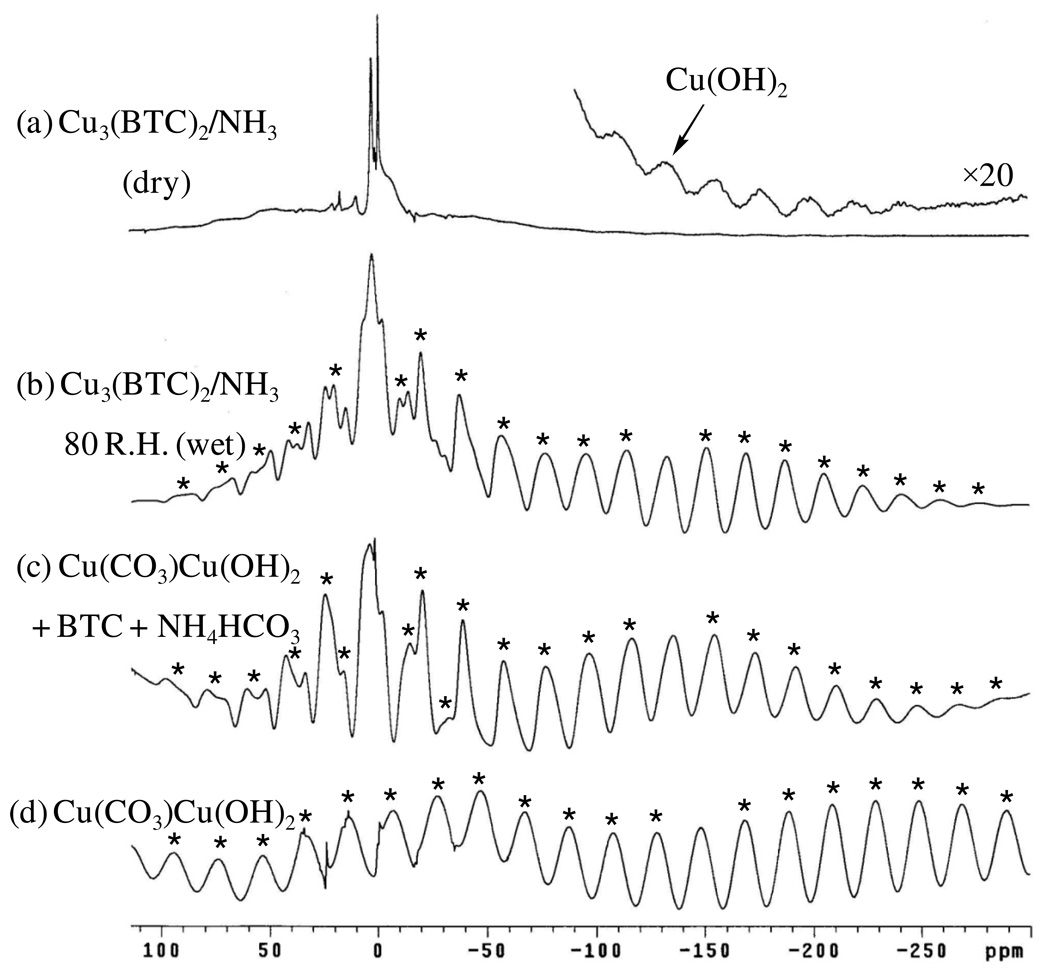
Figure 15.
1H MAS NMR spectra obtained for Cu3(BTC)2 exposed to NH3 under (a) dry (9.4 T, υR = 7000 Hz) and (b) humid (80 % R.H., 14 T, υR = 10,000 Hz) conditions. Spectrum (c) (9.4 T, υR = 7000 Hz) was obtained from the reaction of BTC with Cu(CO3)Cu(OH)2 and NH4HCO3 (see text). The spectrum of Cu(CO3)Cu(OH)2 ((9.4 T, υR = 7000 Hz) is shown in (d). Spinning sidebands are marked by asterisks in the lower spectra. Enhanced inset in spectrum (a) shows centerband for Cu(OH)2 species (see text).

