FIG. 1.
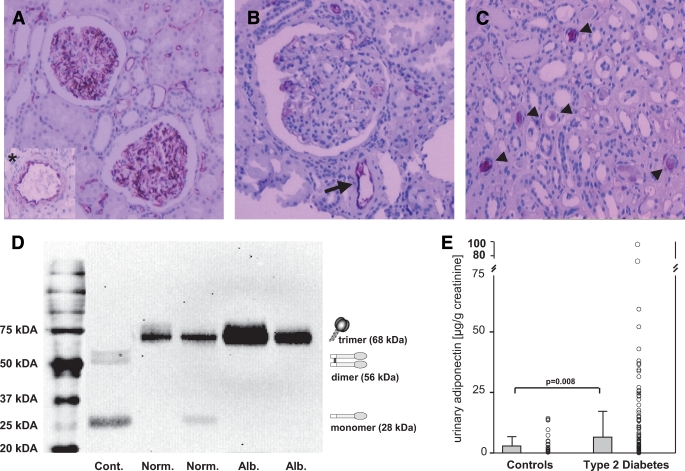
Adiponectin in human kidneys and urinary adiponectin excretion. Immunohistochemical analyses (ABC-POD method) of human kidney tissues for adiponectin. A: Nondiabetic kidneys demonstrate strong endothelial adiponectin staining lining the glomerular and intertubular capillaries as well as intrarenal arteries/arterioles (inserted panel). B: In patients with early diabetic nephropathy, adiponectin staining was considerably decreased in glomerular capillaries, showing an inhomogeneous, segmental pattern. However, adiponectin was still present at the endothelial surface of intrarenal arteries/arterioles (arrow). C: Positive adiponectin staining of tubular casts (arrowheads) in patients with diabetic nephropathy. D: Identification of adiponectin in urine. Urine from healthy individuals (Cont.), type 2 diabetic patients with normoalbuminuria (Norm.), and with microalbuminuria (Alb.) was analyzed by Western blotting and representive findings are presented. In type 2 diabetic patients, bands were found running at ∼75 kDa, most likely representing the adiponectin trimer (68 kDa). An additional weak band running at ∼25 kDa represents the adiponectin monomer (28 kDa). In healthy control subjects, only adiponectin dimers (56 kDa) and monomers were found, and signal intensity was clearly decreased compared with the diabetic patients studied. E: Dots represent individual urinary adiponectin levels in 156 patients with type 2 diabetes and 40 healthy control subjects. Mean urinary adiponectin (±SE) was significantly higher in patients with type 2 diabetes compared with control subjects (P = 0.008; gray bars). (A high-quality digital representation of this figure is available in the online issue.)

