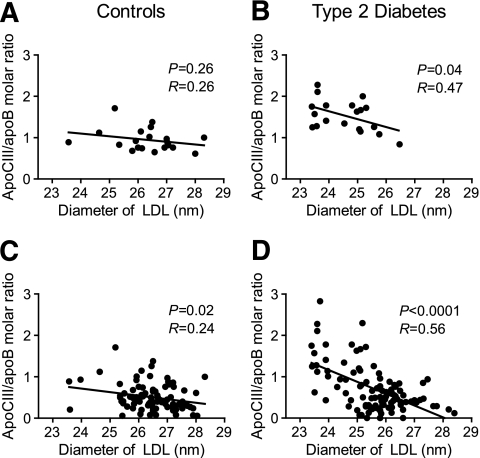
FIG. 4.
Analysis of the LDL-apoCIII/apoB molar ratio versus the LDL diameter of the samples analyzed in Fig. 2 showed a significant negative correlation in subjects with type 2 diabetes (P < 0.05) but not in control subjects (Fig. 4A and B). Analysis of the LDL-apoCIII/apoB molar ratio versus the LDL diameter in all available samples showed a significant negative correlation in both control subjects (n = 93; P < 0.05) and subjects with type 2 diabetes (n = 101; P < 0.0001) (Fig. 4C and D).

