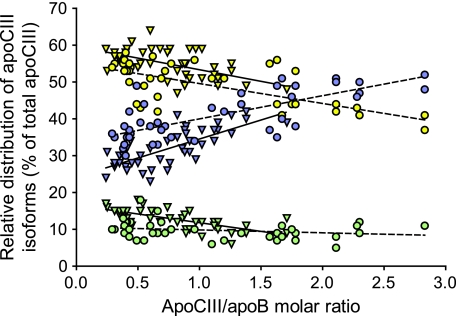
FIG. 6.
The relative distribution of apoCIII isoforms in LDL versus the LDL-apoCIII/apoB molar ratio. ApoCIII isoforms were quantified in LDL isolated from control subjects (n = 44; ▾) and subjects with type 2 diabetes (n = 42; ●), using isoelectric focusing and Western blot analysis. Disialylated apoCIII are shown in blue, monosialylated apoCIII are yellow, and nonsialylated apoCIII0 are green. The linear regression is shown separately for control subjects (filled line) and subjects with type 2 diabetes (dotted line). ApoCIII0 control subjects (r = −0.67, P < 0.0001); apoCIII0 DM2 (r = 0.24, NS); apoCIII1 control subjects (r = −0.59, P < 0.0001); apoCIII1 DM2 (r = −0.69, P < 0.0001); apoCIII2 control subjects (r = 0.76, P < 0.0001); and apoCIII2 DM2 (r = 0.73, P < 0.0001).

