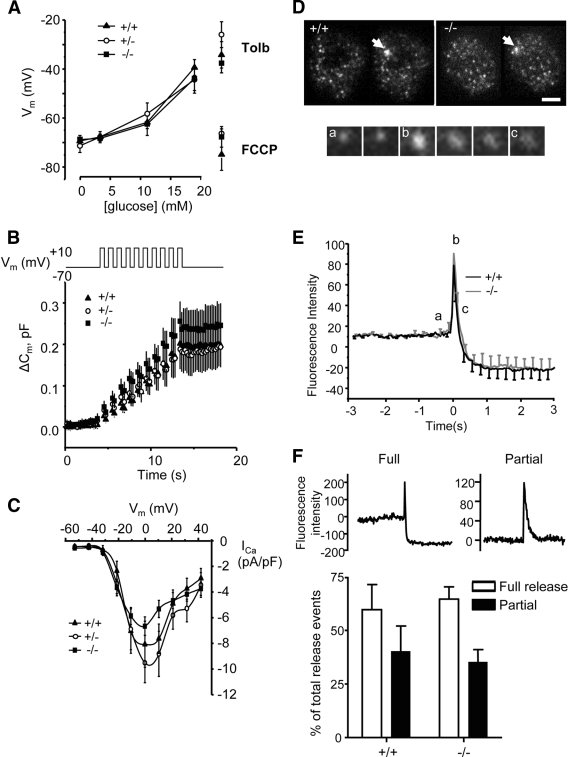
FIG. 5.
Electrophysiological changes and TIRF imaging of exocytosis in single β-cells. A: Membrane potential, (B) depolarization-induced capacitance changes, and (C) Ca2+ currents recorded in pancreatic islet cells: ZnT8+/+ (▲, n = 17), ZnT8+/− (○, n = 16), and ZnT8−/− (■, n = 26) animals (London, 12 weeks). A: Mean values of the whole cell capacitance change versus time are given; data were reduced to show 200 points for clarity. The stimulation protocol is given schematically above the graph. D: TIRF images of β-cells before and after stimulation; scale bar, 5 μm. Release events are indicated by an arrow. Snapshots of a single release event. a–c: Mark the points seen on the graph in E Kinetics of NPY Venus release. Data are normalized to baseline to exclude expression artifacts. Data expressed as the average of 38 versus 43 events (6 vs. 12 separate cells for +/+ vs. −/−; three separate preparations per genotype). F: Proportion of full and incomplete release events.

