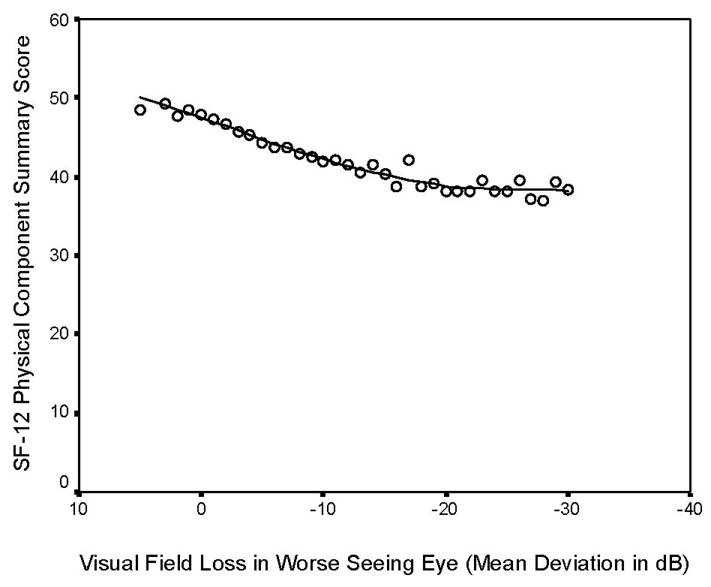
Figure 4.

Linear regression plot of SF-12 Physical Composite scores and visual field loss (Mean Deviation scores in decibels) in worse seeing eye. The SF-12 Physical Composite scores are adjusted for co-variates including age, gender, education, employment status, income, acculturation, comorbidities, health insurance, vision insurance, and visual acuity impairment. The mean deviation-specific data of all persons by each unit of mean deviation of visual field loss were plotted to show the independent relationship of visual field loss with generic health-related quality of life.
