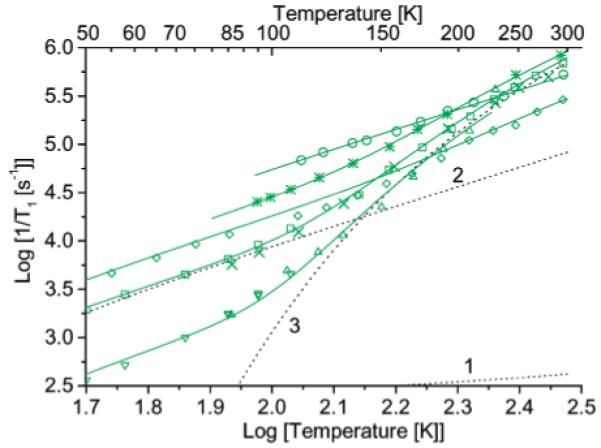
Figure 10.

Temperature dependence of 1/T1 for diradicals in sucrose octaacetate: (green circles) 1b by SR at X-band, (green squares) 2a by SR at X-band, (green crosses) 2a by inversion recovery at Q-band, (green asterisks) 2b by inversion recovery at X-band, (green diamonds) 3 by saturation recovery (SR) at X-band. Temperature dependence in glycerol: (green down triangles) 2a by SR at X-band and (green up triangles) 2a by SR at Q-band. The positions in the spectra where the data were recorded are marked in Figure 4b. The solid lines are fit lines calculated with the parameters in Table 3. The dashed lines 1, 2, and 3 are the contributions to relaxation for 2a in sucrose octaacetate calculated for the direct, Raman, and local mode processes, respectively.
