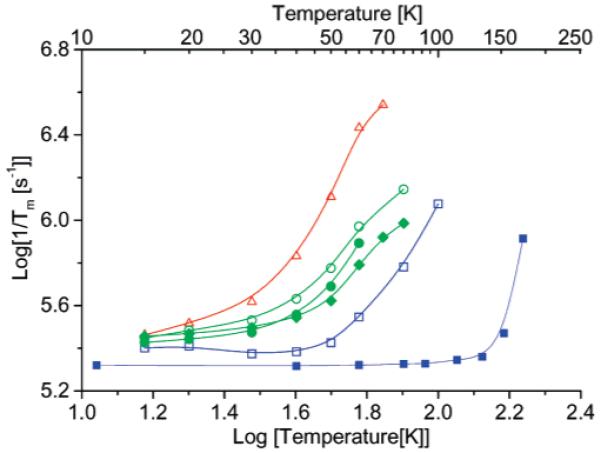
Figure 5.

Temperature dependence of 1/Tm at X-band: (red open triangles) tetraradical 1a, (green open circles) diradical 1b, (green solid diamonds) diradical 2a, (green solid circles) diradical 2b, and (blue open squares) monoradical 1c, in 4:1 toluene/CHCl3, and (blue solid squares) Fremy’s salt in water/glycerol. Relaxation rates were estimated by a single-exponential fit. Lines connect the data points. The positions in the CW spectra at which relaxation rates were measured are shown in Figure 4.
