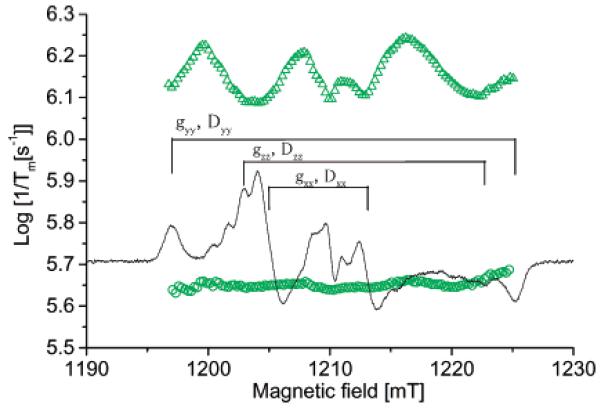
Figure 6.

Dependence of 1/Tm for diradical 2a on position in the spectrum at 86 K at Q-band in (green circles) glycerol and (green triangles) sucrose octaacetate. Relaxation rates were estimated by a single-exponential fit. The plots of relaxation rates are superimposed on the Q-band CW spectrum in sucrose octaacetate.
