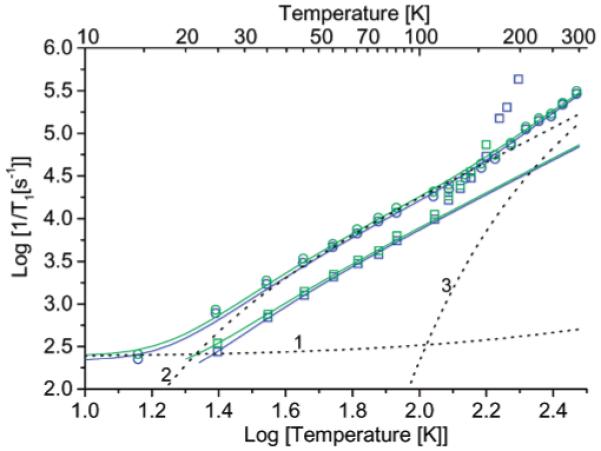
Figure 7.

Comparison of the temperature dependence of 1/T1 in 4:1 toluene/CHCl3 for (green squares) 3 and (blue squares) 3_mono and in sucrose octaacetate for (green circles) 3 and (blue circles) 3a_mono. The dashed lines 1, 2, and 3 are the contributions to the relaxation of 3 in sucrose octaacetate calculated for the direct, Raman, and local mode processes, respectively.
