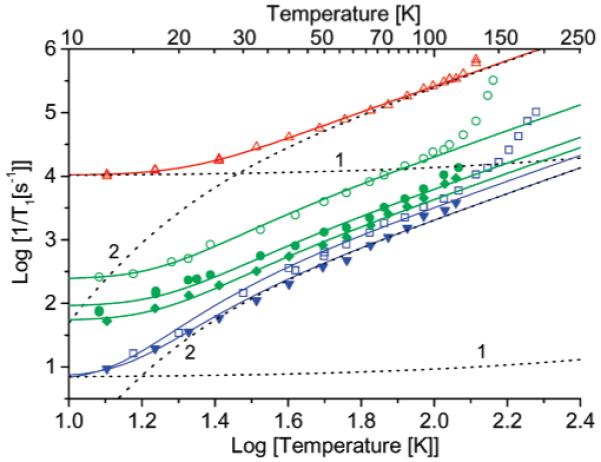
Figure 8.

Spin lattice relaxation 1/T1 in 4:1 toluene/CHCl3 at X-band: (red triangles) tetraradical 1a, diradicals ((green open circles) 1b, (green solid circles) 2b, and (green diamonds) 2a) and monoradicals (blue squares) 1c and (blue triangles) 2a_mono) measured by saturation recovery (SR). The positions in the spectra where the data were recorded are marked in Figure 4b. The dashed lines 1 and 2 are the contributions to the relaxation of 1a and 1c calculated for the direct and Raman processes, respectively. The solid lines are calculated using the fit parameters listed in Table 3 and Supporting Information Table S1.
