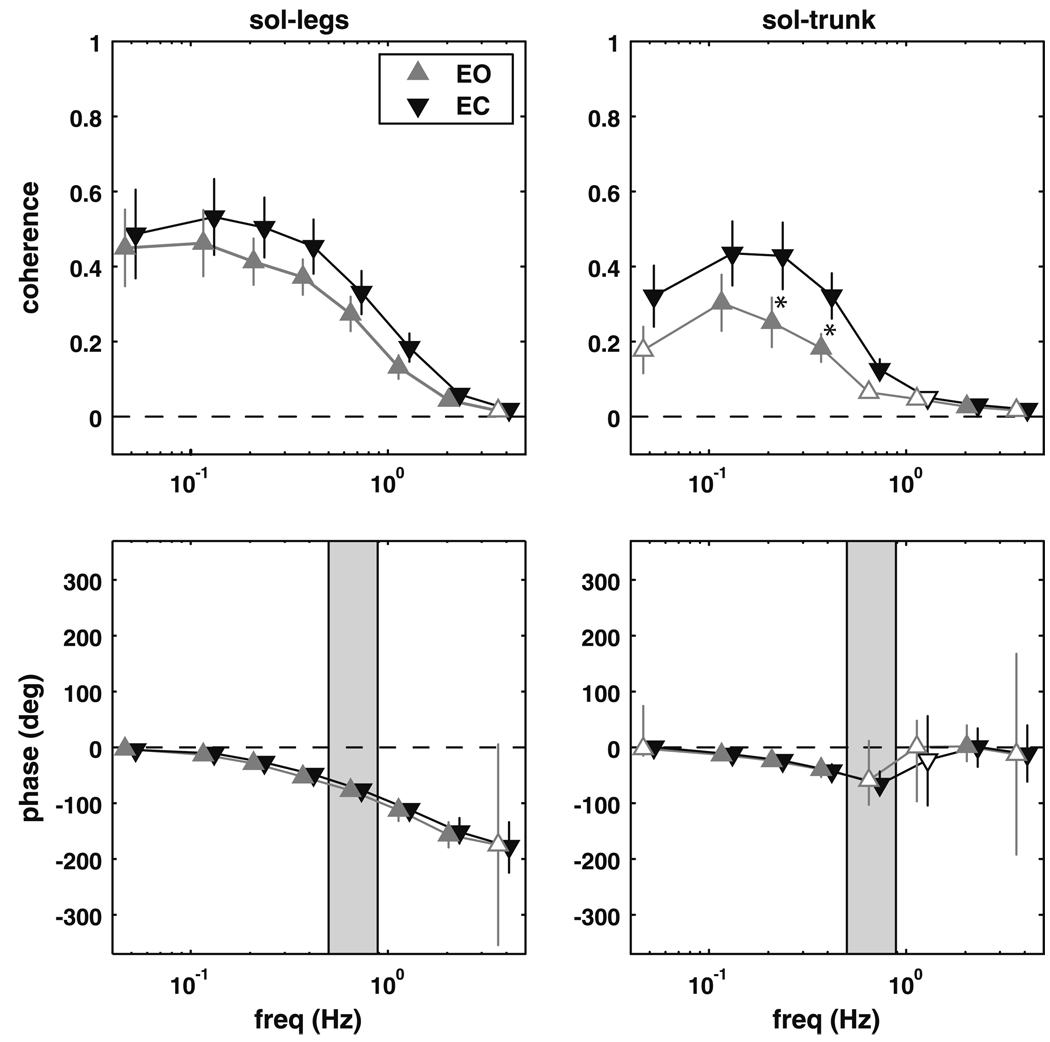
Fig. 2.
Magnitude squared coherence (±SEM) and phase (±95% CI) extracted from the soleus–legs and soleus–trunk complex coherence. Filled triangles represent frequency bins where the complex coherence was significantly different from zero. Shaded region represents the frequency range where the trunk–legs complex coherence was not different from zero. A significant difference between the eyes open (EO) and eyes closed (EC) conditions is denoted by an asterisk

