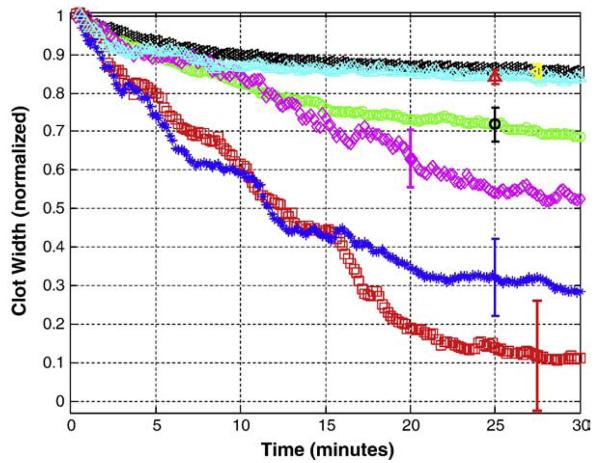
Fig. 1.
Average CWNC(t) as a function of time for clots exposed to tPA, t-ELIP, and ultrasound. Normalized average clot width is shown for control(-US) (◁), control(+US) (△), tPA(-US) (○), t-ELIP(-US) (◇), tPA-treated(+US) (*), and t-ELIP(+US) (□) trials. The vertical bars show representative standard deviations for the data.

