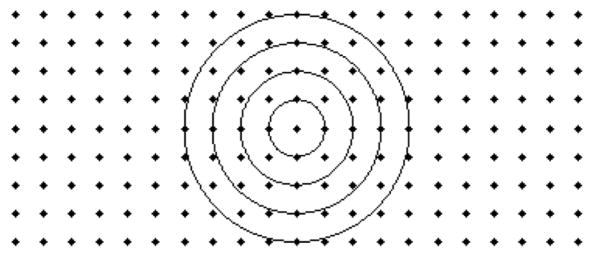
Figure 3.
Image of the locations of k-space samples (represented by dots) of a hypothetical blade with 9 lines and 21 samples per line, and an example of the Kr lines that would be used for rotation correction. The outermost Kr line defines the border of the central disc of k-space sampled by all blades.

