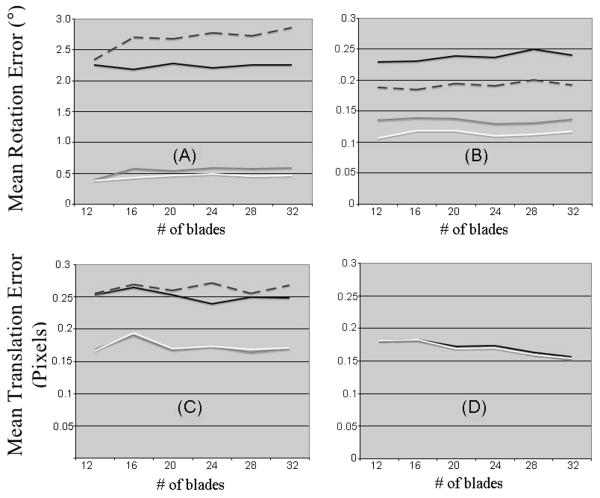
Figure 6.
Graphs of the mean rotation error (A, B) and mean translation error (C, D) in PROPELLER-MRI as a function of the number of blades, for blades with 16 lines (A, C) and 32 lines (B, D). The amount of added motion in each blade was simulated by sampling from a Gaussian distribution with standard deviation of 5° and 5 pixels. Rotations were estimated using AL (solid black curve), DARTw (white curve), DART (dotted curve), and OL (grey curve).

