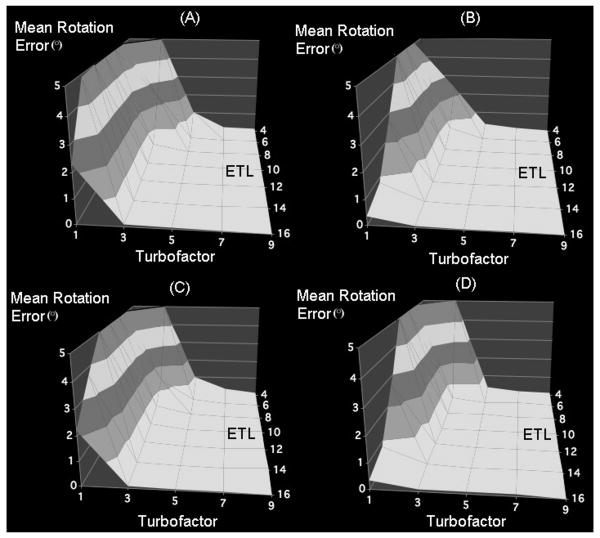
Figure 7.
Surface plots of the mean rotation error in Turboprop-MRI for different combinations of ETL and turbofactor, when using DART (A), DARTw (B), AL (C), OL (D). The amount of added motion was simulated by sampling from a Gaussian distribution with standard deviation of 5° and 5 pixels. 12 blades were used for all sampling patterns in this example. The combinations of ETL=16, turbofactor=9, and ETL=4, turbofactor=1 were not investigated.

