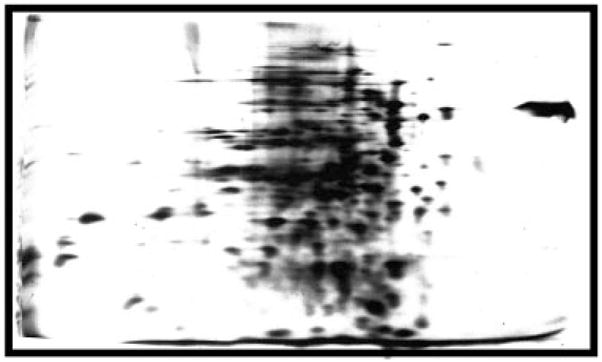
Figure 2.

My first two-dimensional gel. Much of the early work in getting the gels working involved development of ways to run good IEF separations in presence of denaturants that would allow me to run whole cell preparation. After fussing with approaches for a few months this is what I obtained in my first attempt at adding the second dimension. The image is an auto-radiogram of E. coli proteins labeled by growth in the presence of 14C labeled amino acids. The isoelectric focusing dimension is on the horizontal axis with the basic side to the left, and the SDS separation displays high-molecular weight proteins toward the top and low toward the bottom. This is the orientation that I have always used, but others have chosen to change it creating a problem of standardization. The separation is compromised by clustering of the proteins in the center of the IEF dimension, by streaking, and by fuzzy spots. I was later able to improve these aspects.
