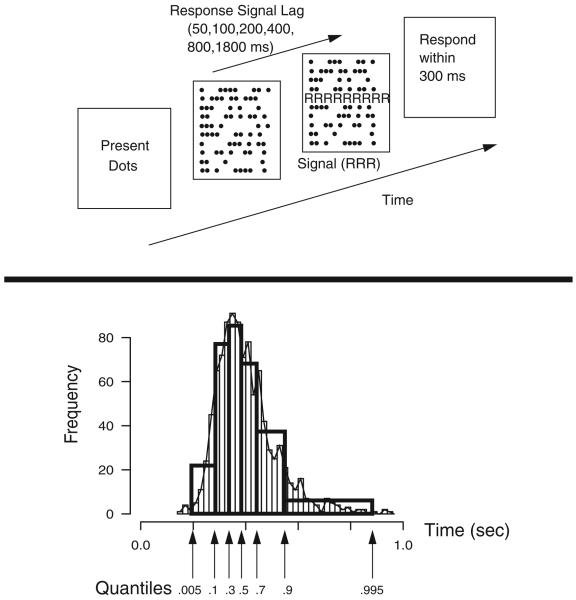
Figure 2.
The top panel shows the time course of events in the experimental paradigm. The bottom panel shows how a response time (RT) distribution can be constructed from quantile RTs (on the x-axis) drawing equal area rectangles between the .1, .3, .5, .7, and .9 quantile RTs and rectangles of half the area at the extremes.

