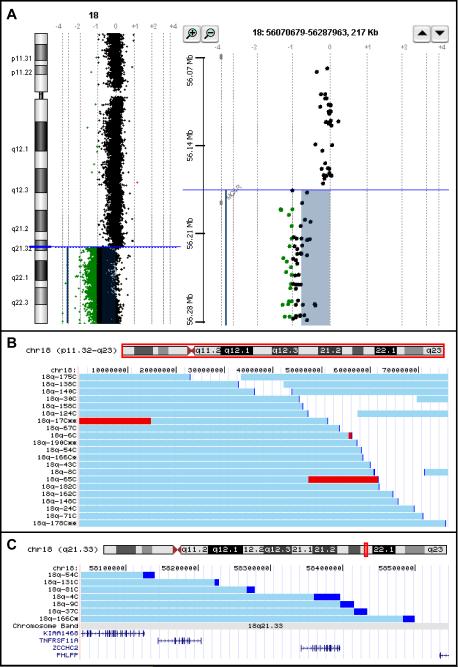
Figure 1.
A. Example of aCGH data using the CHG Analytics software package from Agilent Technologies. The colored bars indicate the features that are significantly different from 0 on the log2 scale. Features exactly on the 0 line have a 1:1 red green color ratio between the test and reference DNA samples
Left panel: The “Chromosome View” from the CGH Analytics software program showing the data from an individual with an 18q deletion
Right panel: The “Gene View” from CGH Analytics showing the breakpoint in relation to the location of the genes in that region.
B. Chromosome 18 content aCGH data from 21 individuals displayed as custom tracks on the UCSC Genome Browser. The horizontal light blue bars depict the region of chromosome 18 that is present in two copies. The darker blue sections are the breakpoint regions. The red regions are present in three copies. All individuals who have retained a distal segment of chromosome 18 have interstitial deletions and not translocations to other chromosomes. Those individuals with as single asterisk by their study number have a rearrangement involving another chromosome, but that other chromosome had no net copy number change. Those individuals who have a double asterisk by their study number have a net copy number abnormality involving a non-18q region of the genome.
C. A zoomed in view of the data in Figure 2 showing the breakpoints of 7 individuals aligned with the RefSeq genes in the region.

