
Figure 3.
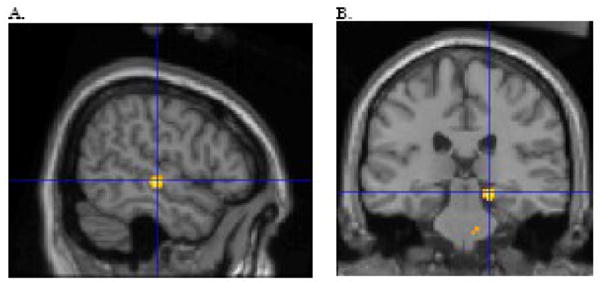
The ASD relative to the control group showed stronger functional connectivity in the right temporal lobe, t(22) = 3.56 p = .001, xyz 54 −20 −2 (A) and the right parahippocampal gyrus, t(22) = 3.66 p = .001, xyz 18 −28 −12 (B). For the illustration, the threshold was set at p = .01 with a minimum cluster size of 50 voxels. The figure depicts voxels showing significant correlation with the seed and the voxels showing a significant difference in correlation between subject groups.