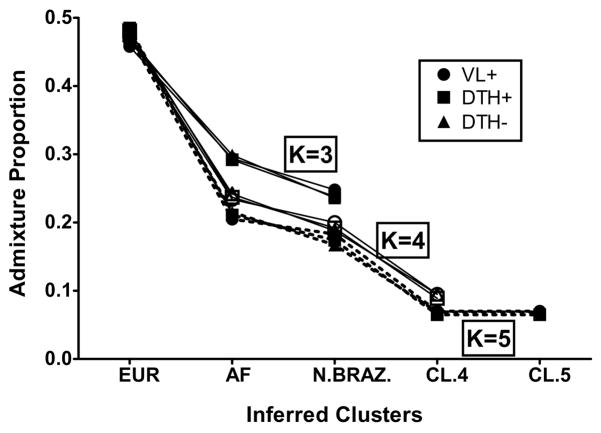
Figure 3. Genome-Wide Admixture Proportions By Leishmaniasis Phenotype.
Genome-wide admixture proportions by clinical phenotype under the ‘Linkage’ model, assuming independent allele frequencies, for various K values. There were no differences between clinical phenotypes in the estimated admixture proportions for K=3, 4 or 5 under the model parameters. As K increased, the component of European admixture stayed relatively constant, whereas the estimated African component showed the greatest drop, suggesting STRUCTURE detected the greater genetic CEPH Diversity of African-derived ancestral genotypes.

