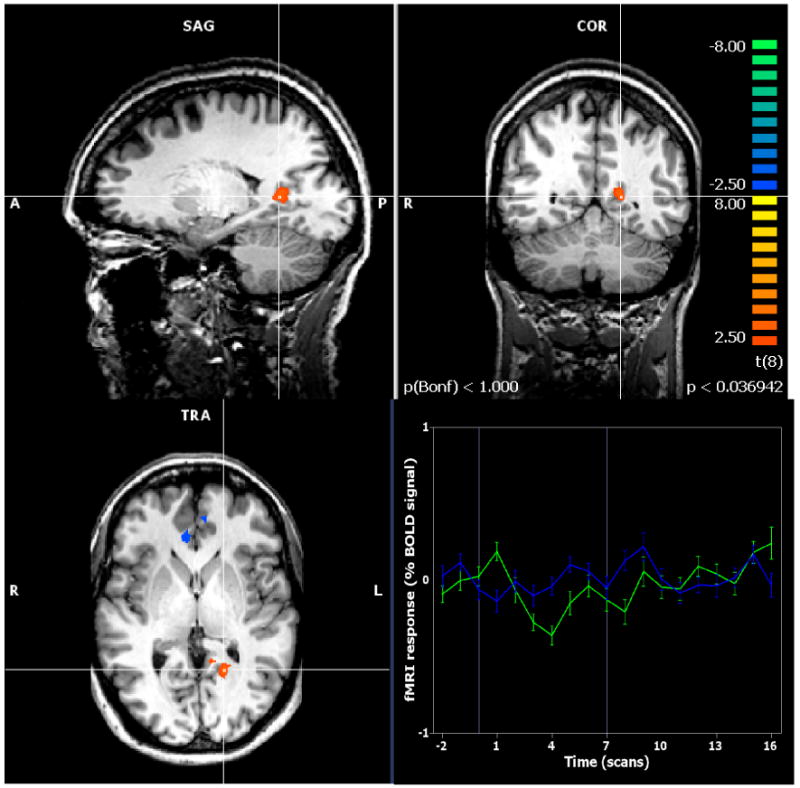
Figure 3.

Kana minus kanji subtraction, showing activation of the left posterior cingulate displayed with the cluster level correction of p < 0.05. The line graph represents the percent BOLD signal change in this left posterior cingulate ROI over time (kana in blue, kanji in green).
