Figure 2.

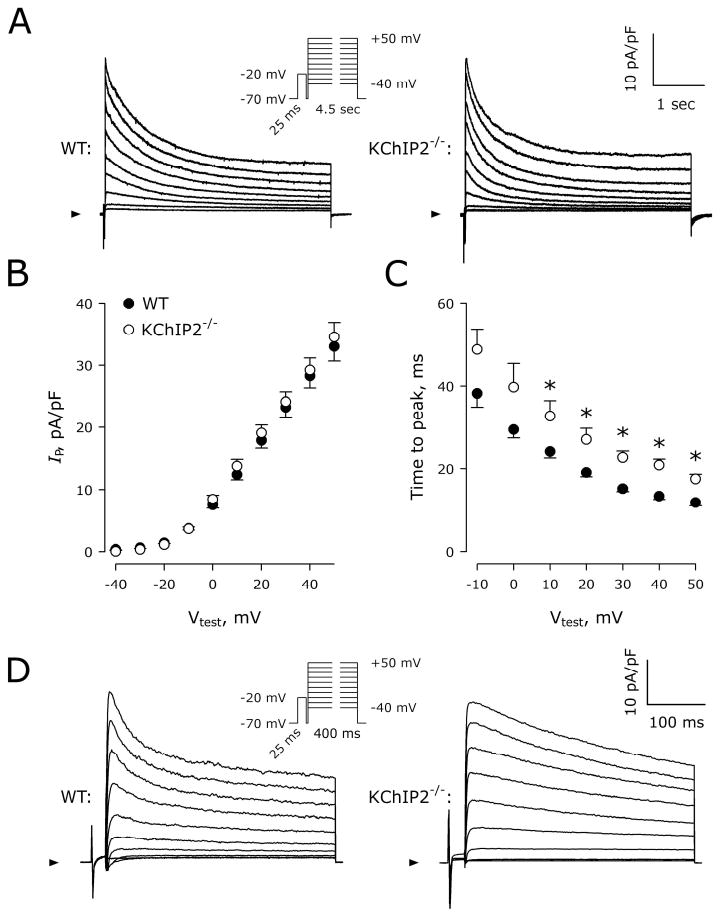
Comparison of KV currents in WT and KChIP2-/- myocytes. A, Representative current traces normalized to cell capacitance recorded from WT and KChIP2-/- cells using 4.5-s depolarizing steps from VH=-70 mV to Vstep=-40 to +50 mV (Inset). Each step was preceded by a 25 ms depolarization to -20 mV to eliminate contamination by inward Na+ current not completely blocked by TTX. Arrowheads indicate 0 pA. B, IP densities plotted as a function of Vtest in WT (n=27) and KChIP2-/- (n=24) myocytes. C, Time interval from cell depolarization to peak current as a function of Vtest. *, P<0.05 versus WT. D, Representative current traces normalized to cell capacitance recorded from a WT and a KChIP2-/- cell using 400-ms depolarizing steps. Although peak current amplitude is comparable, the WT cell displays faster current inactivation within the first ∼100 ms.
