
Figure 1.
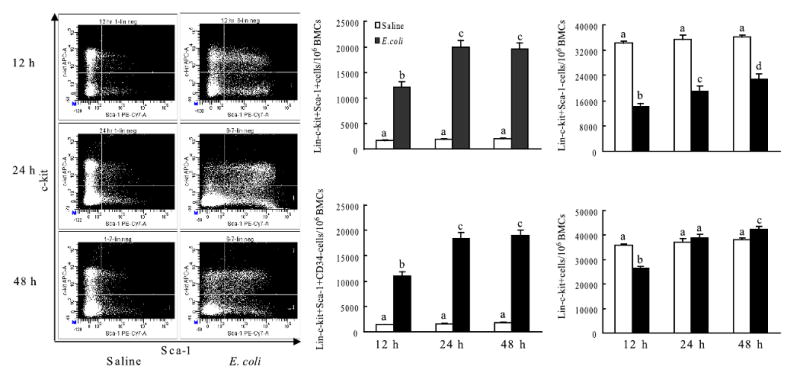
Changes in cell populations in bone marrow following bacteremia and representative dot plots of c-kit-APC vs. Sca-1-PE-Cy7 of lineage negative bone marrow cells. N=5∼9. BMCs: bone marrow cells; Bars with different letters in each panel are statistically different (p<0.05).