
Figure 7.
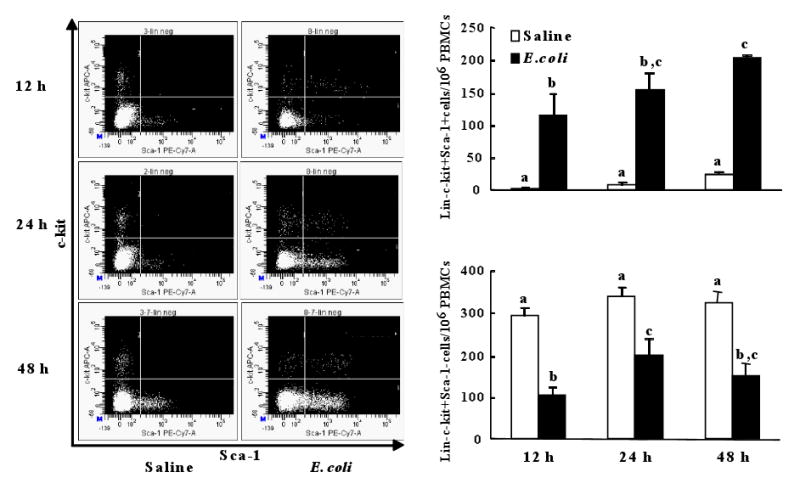
Changes in the number of lin-c-kit+Sca-1+ and lin-c-kit+Sca-1- cells in peripheral blood mononuclear cells (PBMCs) following bacteremia and representative dot plots of c-kit-APC vs. Sca-1-PE-Cy7 of lineage negative PBMCs. N=4∼6. Bars with different letters in each panel are statistically different (p<0.05).