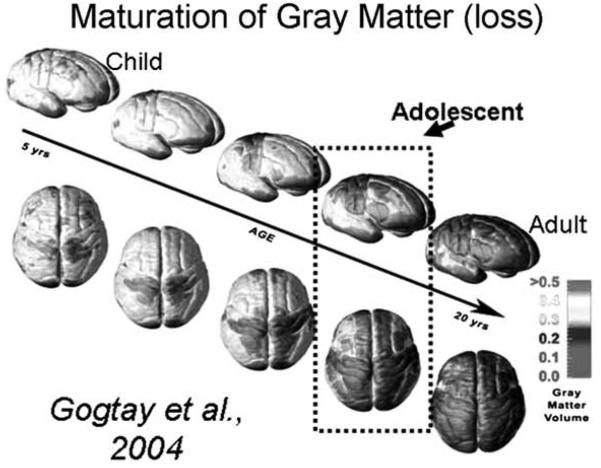
Fig. 1.
View of cortical surface of the brain. Colors represent degree of thinning of gray matter. Blue indicates mature adult-levels have been reached. We have added a box around the brains that represent adolescence (figure from Gogtay et al. (2004). PNAS, 101, 8174–8179).

