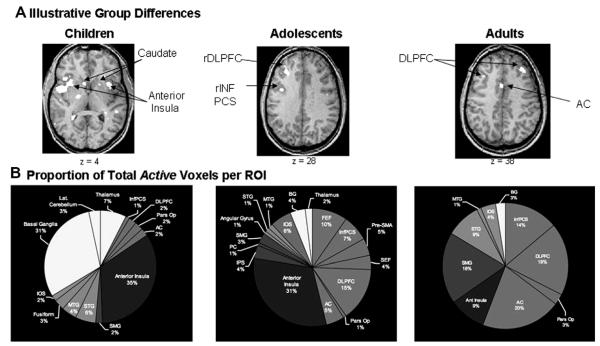
Fig. 7.
Imaging results from both magnitude and extent of activation analyses. (A) Proportion of total number of voxels in each region of interest submitted to extent of activation analyses in all groups. (B) Each group image represents illustrative differences in both the magnitude and extent of activation in the group-averaged percent signal change functional maps. Children showed stronger activation bilaterally in the caudate nucleus, the thalamus, and anterior insula. Adolescents showed the strongest right DLPFC activation, and adults showed concentrated activation in left prefrontal and posterior parietal regions. (C) Group differences in the extent of activation as measured by the proportion of total active voxels in each region of interest for each age group. Despite the fact that the proportion of total voxels in the extent of activation analyses was consistent across the age groups, the groups showed large differences in the proportion of total active voxels across the regions of interest (from Scherf et al. (2006). Journal of Cognitive Neuroscience, 18(7), 1045–1058).

