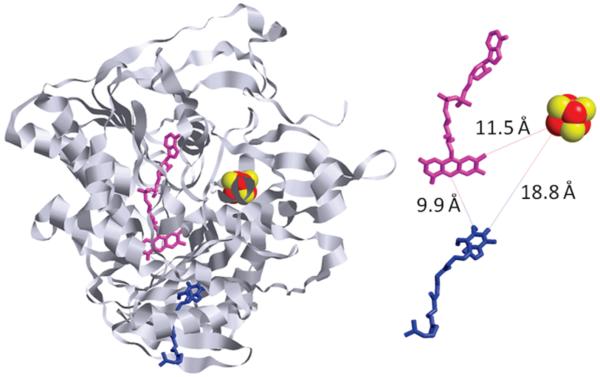
Figure 1.
Crystal structure of porcine ETF-QO (PDB data bank: 2GMH) highlighting the positions of the three redox centers, [4Fe-4S]2+,1+ cluster (red and yellow), FAD (pink), and ubiquinone (blue). On the right the ribbon structure has been removed for clarity, and distances of closest approach of the three redox centers are shown.

