
Figure 1. Profile of Human Breast Cancer Stem Cell miRNA Expression.
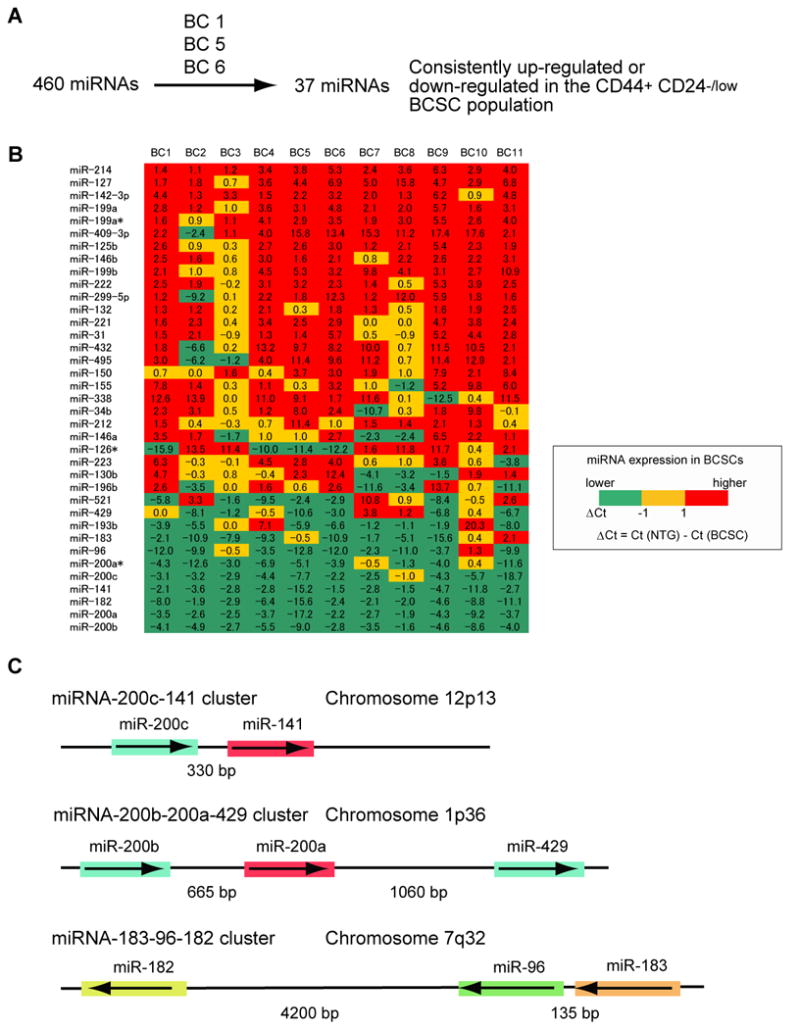
(A) Screening of 460 miRNA expression in human breast cancer stem cells. The details of the screen used to identify the 37 miRNAs differentially expressed by the CD44+CD24-/lowlineage- human breast cancer stem cells (BCSCs) and the remaining lineage- non-tumorigenic cancer cells (NTG cells) are shown schematically. (B) Expression profile of 37 miRNAs in human breast cancer stem cells. Flow cytometry was used to isolate BCSCs and NTG cells from 11 human breast cancer samples (BC1 to BC11). The amount of miRNA expression (Ct value) in 100 sorted cancer cells was analyzed by multiplex quantitative real-time PCR. Numbers represent the difference of Ct values (ΔCt) obtained from BCSCs and NTG cells. (C) A schematic representation of the three miRNA clusters down-regulated in human breast cancer stem cells. The miRNAs sharing the same seed sequence (from 2 to 7 base pairs) are marked by the same color.