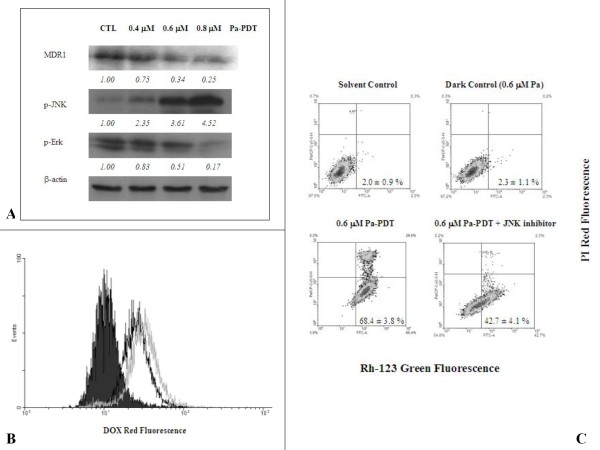
Figure 4.
Pa-PDT inhibits p-glycoprotein mediated MDR in R-HepG2 cells. (A) Differential expression of MDR proteins in Pa-PDT treated R-HepG2 cells. Cells (3 × 10⁶) were treated with Pa alone (0.4 μM Pa without PDT) or (0.4 μM, 0.6 μM, or 0.8 μM) Pa for 2 h and then with light illumination (84 J/cm2) for 20 min. Cells were collected at 2 h after PDT treatment, then cell lysates were analyzed using Western blotting. The protein expression levels were semi-quantified and shown as relative intensities normalized with the band intensity of the housekeeping β-actin in each sample. Representative results from a single experiment are shown from 5 independent experiments.(B) For the intracellular accumulation of Dox, cells (4 × 10⁵/well) were treated with 0.04% ethanol (CTL, black solid), 0.6 μM (black line) and 0.8 μM (gray line) of Pa-PDT, and then the culture medium was changed to 4 μM Dox and further incubated for 2 h at 37°C, 5% CO2. The cells were collected and the intensity of Dox fluorescence was measured by a flow cytometer. (C) For detection of P-glycoprotein activity, R-HepG2 cells (1 × 10⁴/well) were pre-incubated with 0.04% ethanol (solvent control), 0.6 μM Pa (dark control), 0.6 μM Pa-PDT, or 0.6 μM Pa-PDT with 0.5 μM JNK inhibitor in a 6-well plate for 2 h and then the samples were illuminated with PDT. The treated cells were stained with 10 μM Rh-123 for 2 h at 37°C, 5% CO2 and then incubated with 5 μg/ml PI for further 15 min at room temperature. The cells were collected and analyzed by a flow cytometer, where the lower right quadrant (Rh-123 positive and PI negative) represents the cells that have intact plasma membrane but with down-regulated P-glycoprotein activity. The figure is a representative of 5 experiments and the results shown as mean ± SD.

