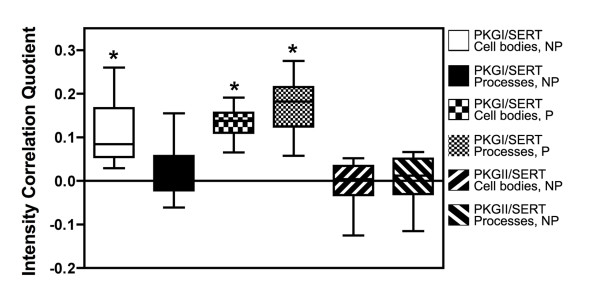
Figure 2.
Quantitative analysis of SERT/PKGI colocalization. Cells were fixed and stained as shown representatively in Figure 1, and the Intensity Correlation Quotient was calculated for both cell bodies and processes under either nonpermeabilized (NP) or permeabilized (P) conditions, as described in Methods. Data represent mean values ± SEM from multiple cells in 4–6 fields, replicated in at least three experiments. Statistical analysis was conducted by one-sample t test. *, p < 0.001.

