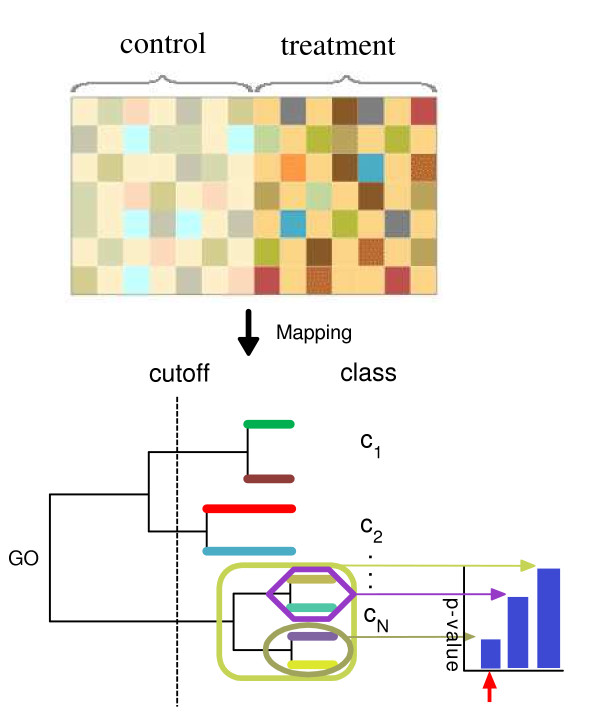
Figure 1.
An overview of the CeaGO method. The upper panel shows the expression of genes in two classes, for example, gene expression in control versus treatment. After genes are annotated to the GO DAG, a dendrogram is generated using a hierarchical clustering method based on semantic similarity. For such a dendrogram, many classes (C1, ..., CN) are obtained when the tree meets a user-defined cutoff (lower left panel). The p-values are computed according to the gene set enrichment analysis for every subset of each class. The lower right panel shows those p-values in a histogram against each subset of the class. The minimum (red arrow) is found and is used to determine the subset (grey green ellipse) of the given class. Such subsets would be assigned as "most likely to be differentially expressed" in the microarray data.

