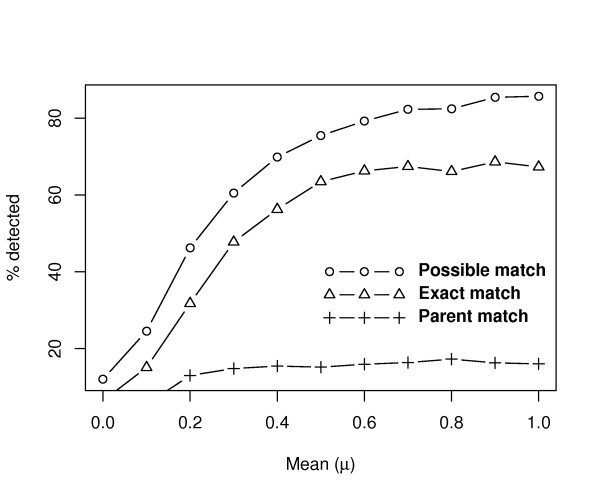
Figure 2.
Effect of changing μ on simulated data. This figure illustrates how results change when the μ is changed. "Exact match" represents the percentage of GO groups enriched by the CeaGO exact match to the pre-selected "truly enriched" gene sets. The "Possible match" groups are those that occur in the pre-selected GO classes. The "Parent match" indicates the percentage of top nodes enriched by the parent-based enrichment method found among the most recent parent nodes of the pre-selected "truly enriched" GO sets.

