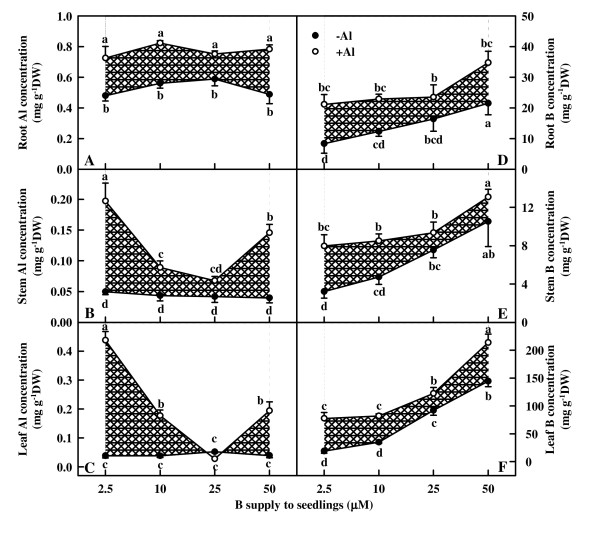
Figure 2.
Effects of Al and B interactions on the concentrations of Al and B in Citrus grandis roots, stems and leaves. Diagonal cross area quantifies the Al effect under different B supply. Each point is mean of 4 – 5 replicates with standard error. Difference among eight treatments was analyzed by 2 (Al levels) × 4 (B levels) ANOVA. P values for Al, B, and the interaction between the two were 0.0001, 0.3206 and 0.3148 (A); < 0.0000, < 0.0000 and 0.0001 (B); < 0.0001, < 0.0001 and < 0.0001 (C); 0.0002, 0.0066 and 0.8568 (D); and 0.0006, 0.0001 and 0.7807 (E); 0.0001, 0.0001 and 0.2002 (F); respectively. Different letters indicate significant differences among eight treatments at P < 0.05.

