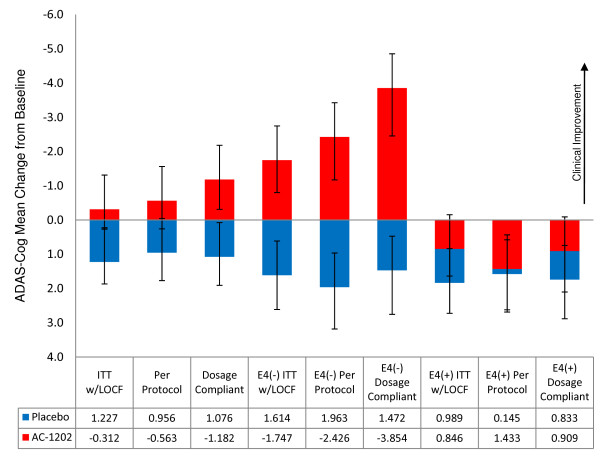
Figure 8.
Summary graph of mean change from Baseline at Day 90 for ITT w/LOCF, per protocol and dosage compliant groups stratified by APOE4 carriage status. Red columns represent subjects receiving AC-1202. Blue columns represent subjects receiving Placebo. Error bars represent standard error of the mean. Table displays mean change from Baseline for each group. Mean changes from Baseline was largest in APOE4(-) subjects who were dosage compliant.

