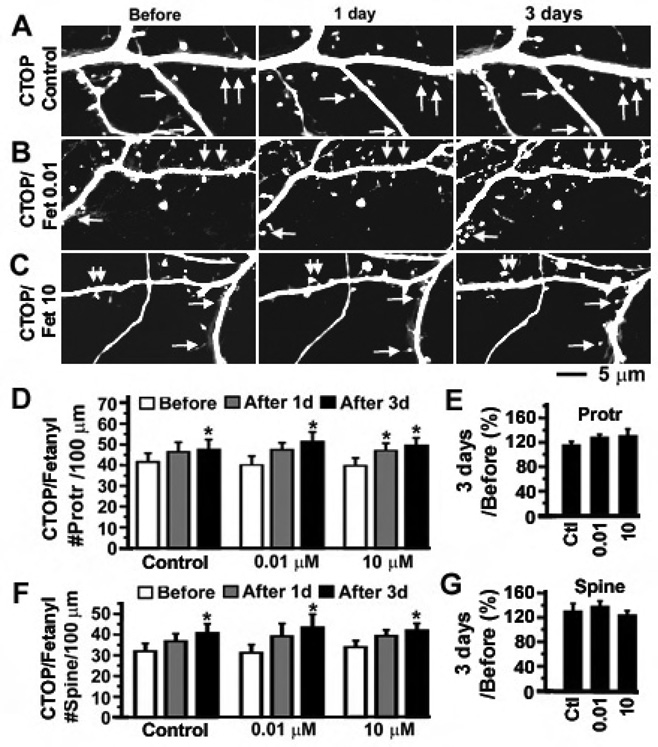
Figure 2. The bidirectional effects of fentanyl on the density of dendritic spines require the participation of MORs.
A–C. CTOP (5 µM) was applied to cultured hippocampal neurons at 14 DIV to block MORs. In the continuous presence of CTOP for 1 week, neurons expressing GFP at 21 DIV were photographed before, 1 day and 3 day after the addition of fentanyl at various concentrations (A. control with CTOP alone; B. fetanyl at 0.01 µM plus CTOP; C. fentanyl at 10 µM plus CTOP; n = 8 neurons each group). Arrows denote emergence of new spines. D and F. The densities of dendritic protrusions and spines (# per 100 µm of dendrites) in the above three groups of neurons were quantified before (open), 1 day (gray) and 3 days (black) after treatment with fentanyl. E and G. In each individual neuron, the density of dendritic protrusions and spines after 3 days of treatment was normalized as percentage by the baseline value before treatment. There is no significant difference in the normalized percentage between the control (CTOP alone, left bar) and testing groups (CTOP + fentanyl (0.01 and 10 µM), middle and left bars). *, p < 0.05; **, p<0.01; ***, p<0.001.

