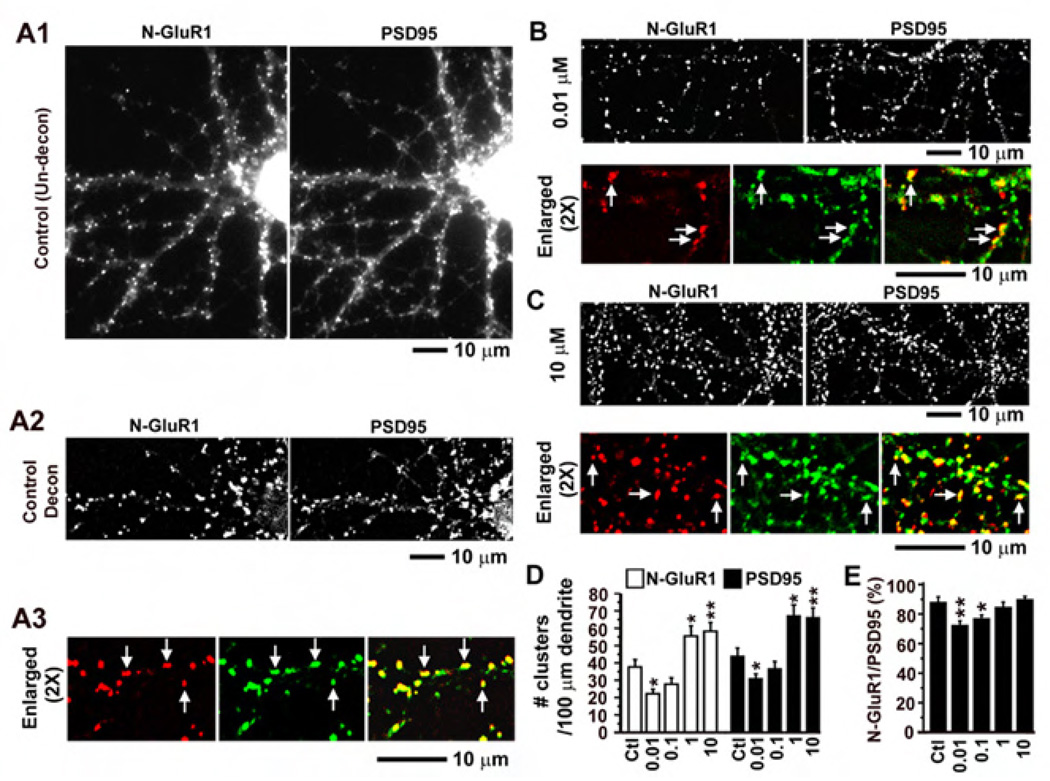
Figure 4. Effects of Fentanyl on surface AMPA receptors and PSD95 in low density cultured neurons.
A1. An untreated control neuron that was co-stained with an antibody against the N-terminus of GluR1 subunits of AMPA receptors (left, red) and an antibody against a postsynaptic maker PSD95 (right, green). The two images were simple averages of stacks of unprocessed images. A2. The two images were from the same neuron as in A1. They were averages of stacks of images that had been processed by deconvolution analyses using the MetaMorph software with the nearest planes. Note that the clusters were sharper after the deconvolution. A3. The deconvoluted images of N-GluR1 staining (left) and PSD95 staining (middle) were enlarged by 2 times and pseudo-colorized to examine the colocalization (right). B and C. Neurons co-stained with antibodies against N-GluR1 and PSD95 that had been treated with fentanyl at a low (0.01 µM) and a high concentration (10 µM), respectively. The deconvoluted images of N-GluR1 (left) and PSD95 (right) were shown on the upper panel (similar to A2) whereas the colocalization was shown on the lower panel (similar to A3). D. The densities of GluR1 and PSD95 clusters were quantified as # per 100 µm of dendrites in neurons that had been treated with fentanyl at concentrations of 0 (control; n=10), 0.01 (n=10), 0.1 (n=10), 1 (n=11) and 10 (n=12) µM. E. The proportion of N-GluR1 clusters that were co-localized with PSD95 clusters versus the total number of PSD95 clusters. *, p < 0.05; **, p<0.01; ***, p<0.001, comparing with the control (0 µM).

