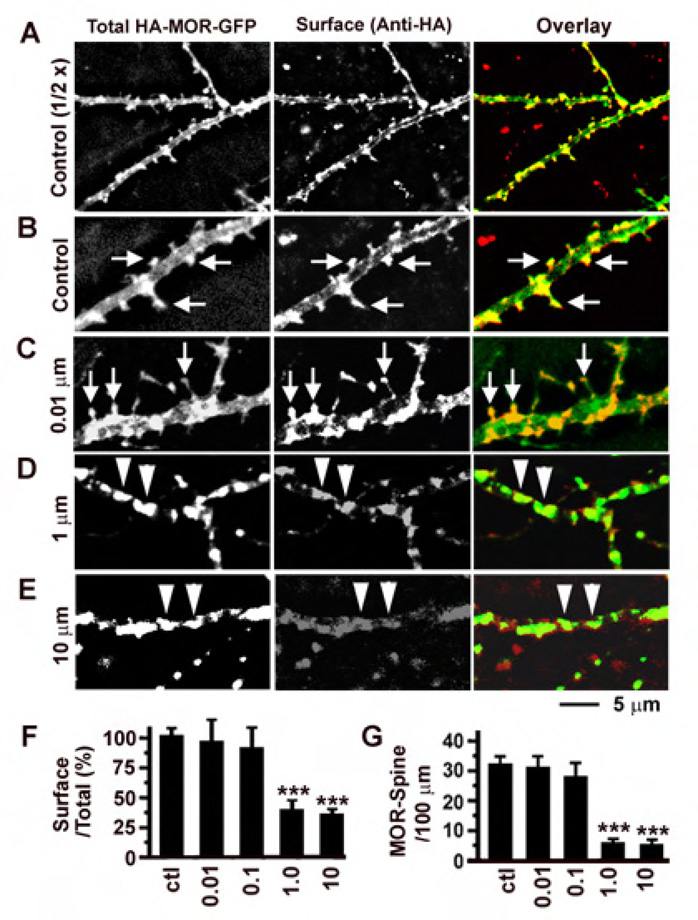
Figure 5. The effect of fentanyl on the internalization of MORs was concentration dependent.
A. An untreated control neuron expressing HA-MOR-GFP (green, left) was stained with an anti-HA antibody (red, middle). Right, overlay. In HA-MOR-GFP, an HA tag was fused to the N-terminus (should be on cell surface) and a GFP tag was fused to the C-terminus (emitting green fluorescence all the time). B. Enlarged images from A. Arrows denote clustering of MORs on the surface of dendritic spines. C-E. Similar neurons treated with fentanyl at different concentrations for 2 hours (1 hour with fentanyl, another with fentanyl + anti-H antibody). Arrows denote clustering of MORs. Triangles denote MORs aggregating in dendrites after internalization. F. The proportion of red fluorescence versus green fluorescence was used to quantify the ratio of surface versus total MORs in neurons that had been treated with fentanyl at 0 (control), 0.01, 0.1, 1 and 10 µM (n=10 in each group). G. The number of MOR-containing dendritic spines per 100 µm dendrites. *, p < 0.05; **, p<0.01; ***, p<0.001, comparing with the control.

