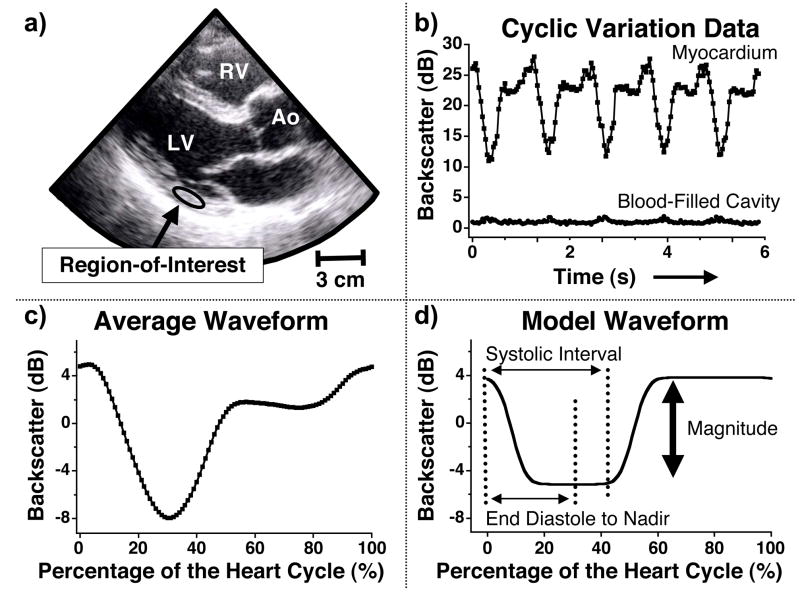
Figure 1.
a) Image showing a representative region-of-interest placed in the posterior wall of the parasternal long-axis view for one subject. RV = right ventricle LV = left ventricle Ao= aorta b) Cyclic variation of myocardial backscatter data from the region-of-interest shown in Figure 1a and backscatter data from the blood-filled cavity. The vertical scale illustrates the relative difference in backscatter results and does not represent an absolute measurement. c) Average waveform calculated from the five heart cycles illustrated in Figure 1b. The data are represented as a zero-mean curve and the heart cycle is defined as starting and ending with end diastole. d) A model waveform utilized in the automated analysis of cyclic variation data (Mohr et al. 1989) to calculate the magnitude and time delay of the cyclic variation of myocardial backscatter. The vertical arrow illustrates the magnitude of cyclic variation, and the normalized time delay is calculated as the time interval from end diastole to the center of the nadir divided by the systolic interval.

